The Creative Nation project by Nesta maps the UK’s creative industries, highlighting their evolution and contribution to local economic development through official and open data.
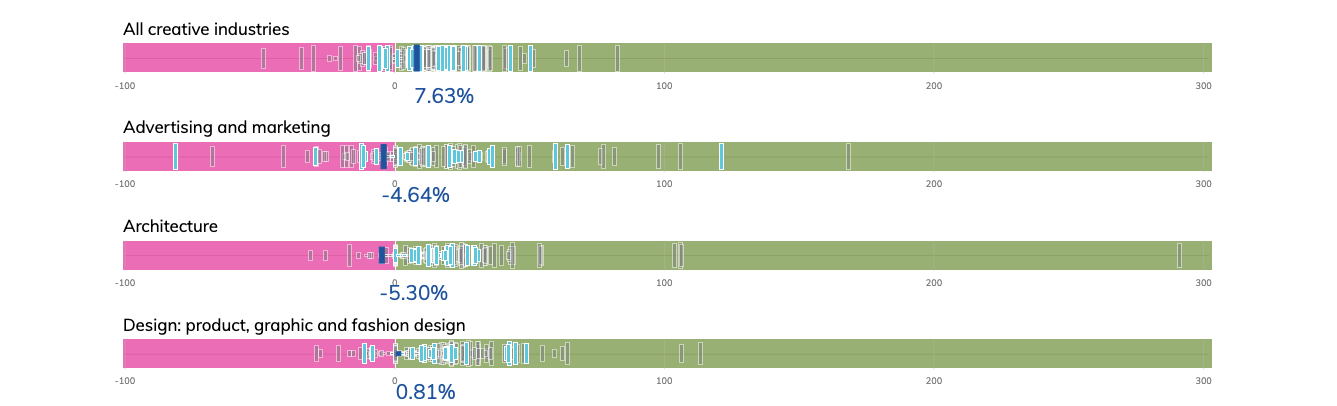
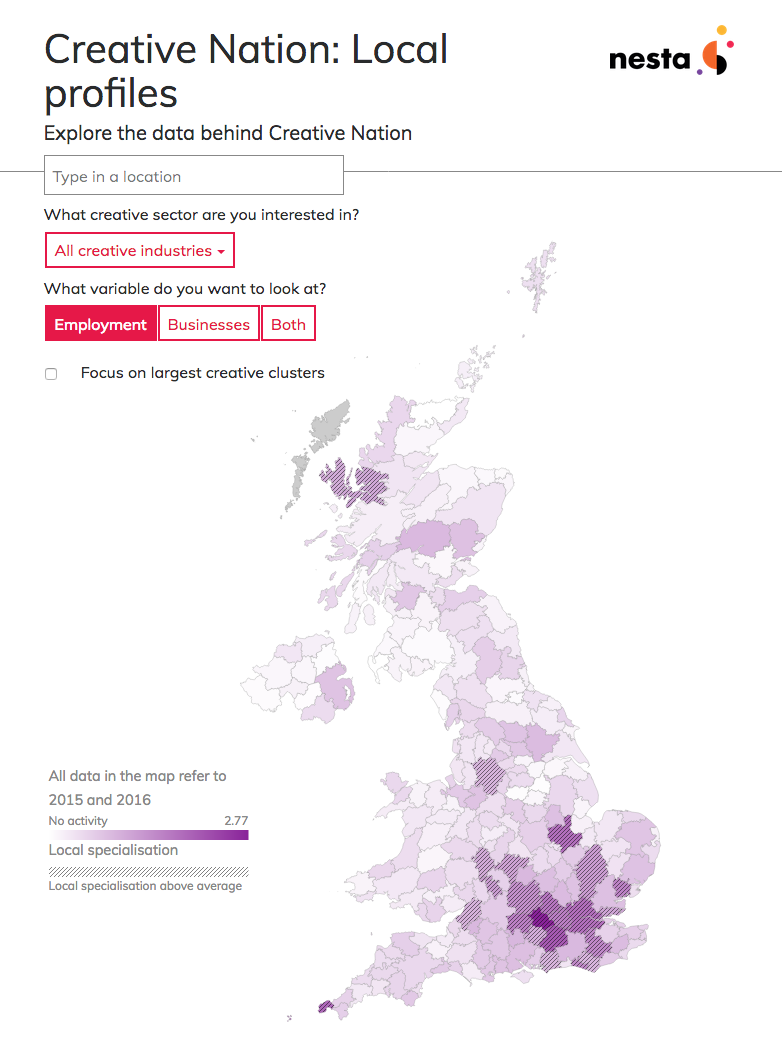
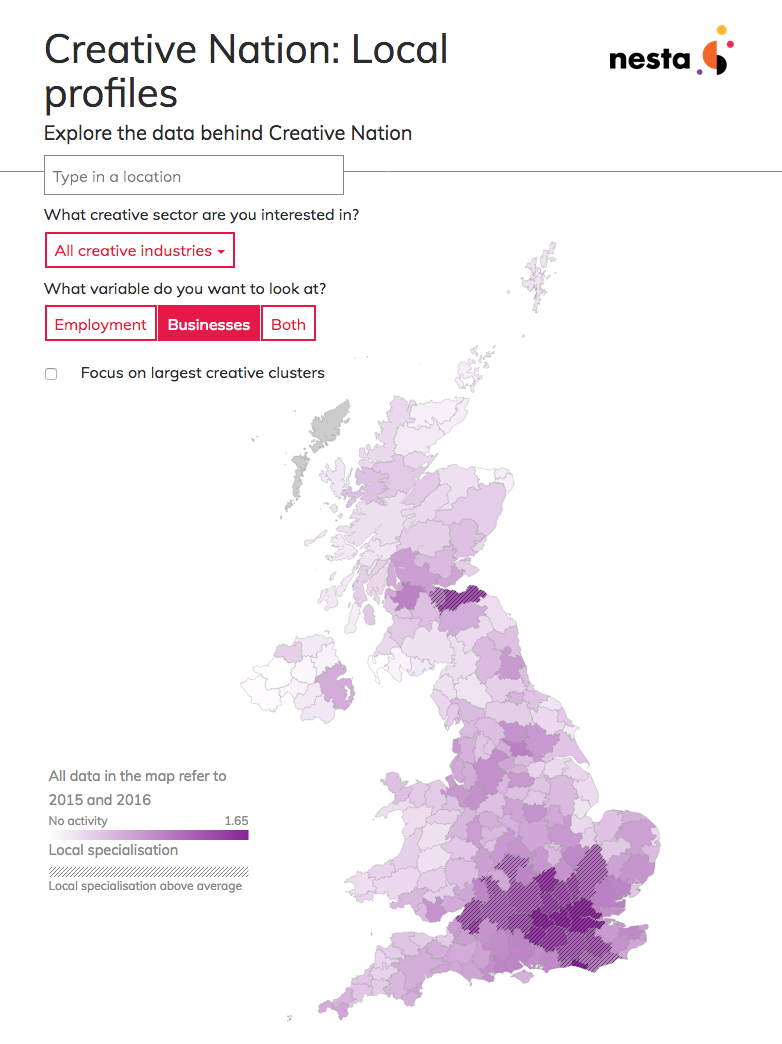
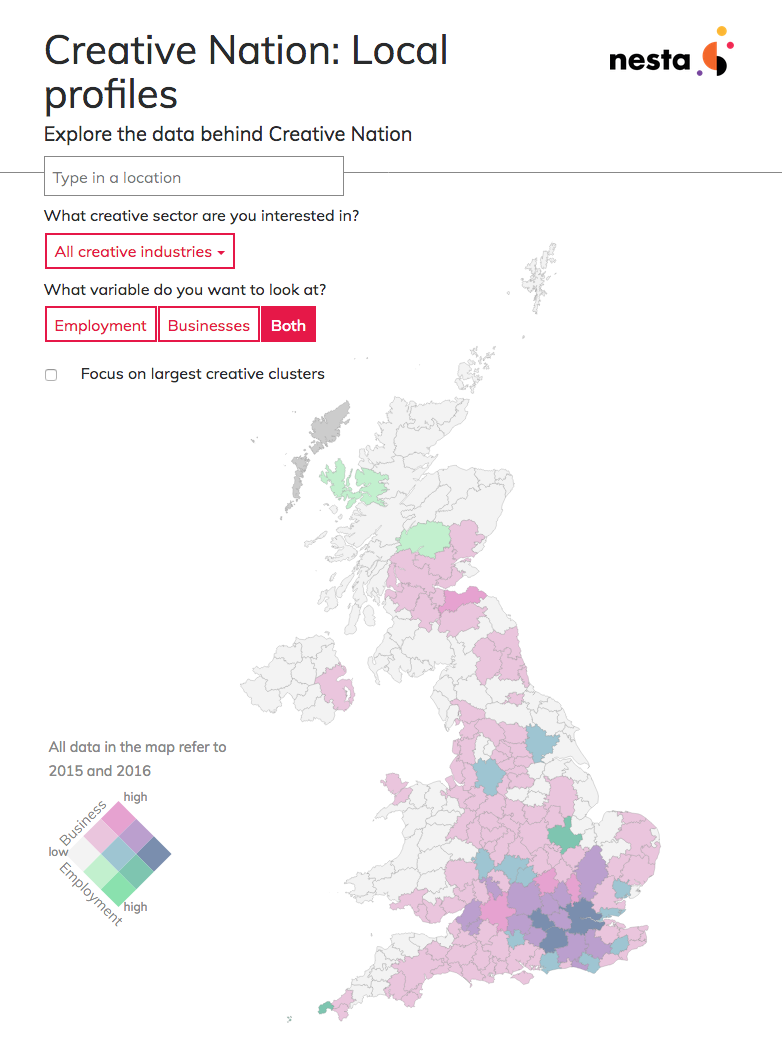
I designed and developed the interactive visualisation Creative Nation: Local Profiles, enabling users to explore data across UK locations. The map shows local specialisation by number of businesses, employment, or both, with options to view all creative industries or individual sectors.
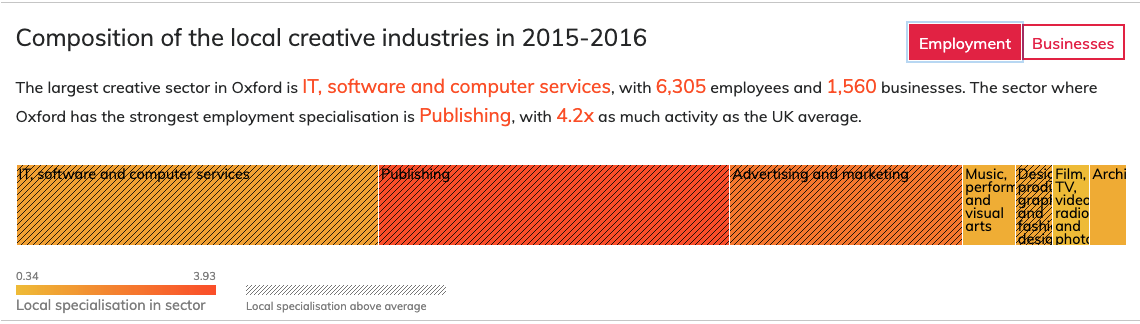
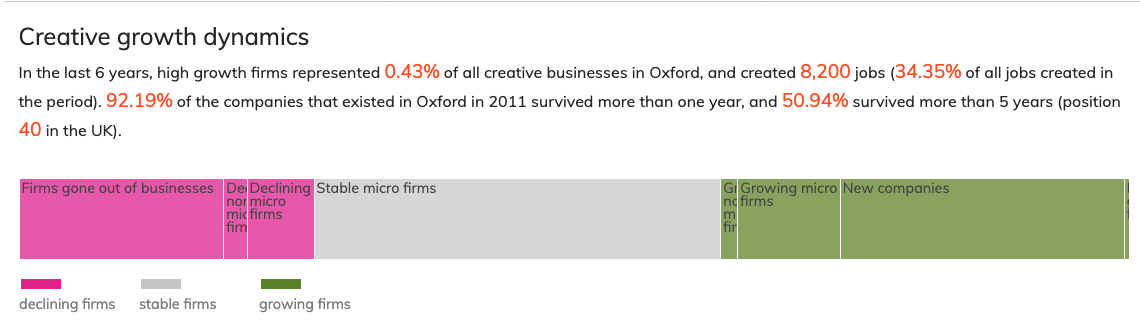
Selecting a location reveals detailed charts on the composition and growth of its creative industries.
1
2
3
Choropleth map showing local specialisation in terms of employment [1] and number of businesses [2]. A bivariate choropleth has been used to show both variables at the same time [3].